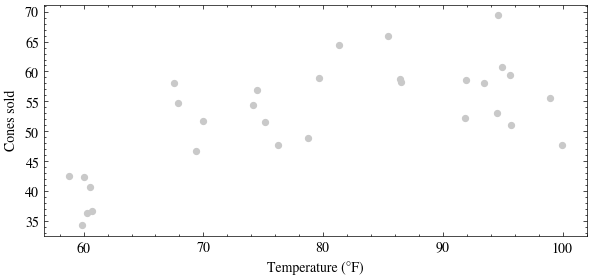
A month at the ice-cream stand: each day we record the temperature \(x\) and how many cones we sold. These points were generated from a hidden function plus noise, \[y = f(x) + \eta,\] and \(f\) is not observed. All we get is the scatter.
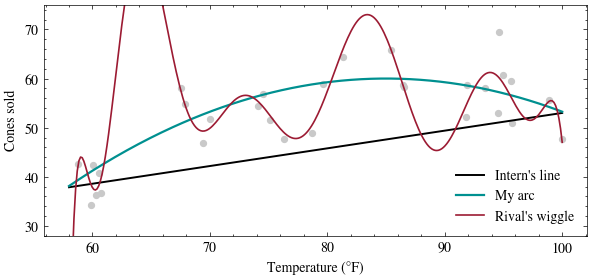
If a candidate is correct, then each day’s gap between the curve and the point is noise \(\eta\). Large gaps are less likely under the assumed noise model, so we score each candidate by the sum of its squared gaps; a smaller total is more plausible:
def score(curve, t, y):return np.mean((curve(t) - y) **2)print("mean squared gap, this month:")print(f" intern's line {score(line, temps, sales):8.1f}")print(f" my arc {score(arc, temps, sales):8.1f}")print(f" rival's wiggle {score(wiggle, temps, sales):8.1f}")# a fresh month of days from the same hidden processtemps2 = rng.uniform(58, 100, size=30)sales2 = hidden_f(temps2) + rng.normal(0, sigma, size=temps2.shape)print("\nmean squared gap, NEXT month:")print(f" intern's line {score(line, temps2, sales2):8.1f}")print(f" my arc {score(arc, temps2, sales2):8.1f}")print(f" rival's wiggle {score(wiggle, temps2, sales2):8.1f}")
mean squared gap, this month:
  intern's line       90.7
  my arc              26.8
  rival's wiggle       9.8

mean squared gap, NEXT month:
  intern's line      117.6
  my arc              19.2
  rival's wiggle     220.2
On this month’s data the high-degree curve has the smallest gaps because it threads the points. On a fresh month from the same process, its error increases while the arc’s score changes little. The high-degree curve fit the first month’s noise rather than the shared relationship. The Methodology lecture analyzes this gap between training and test error.
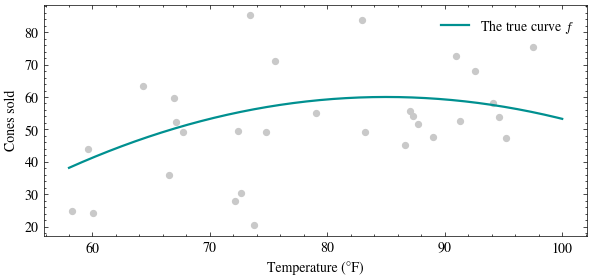
The hidden function used to generate the data was the arc, \(f(x) = 60 - 0.03(x - 85)^2\). Yet even the true curve misses every day by about \(\sigma = 5\) cones; its mean squared gap hovers near \(\sigma^2 = 25\), and no curve can beat that on fresh data.
Changing the noise level
Change \(\sigma\), the standard deviation of the noise. Try sigma = 0 (a world with no birthday parties) and sigma = 15 (chaos).
true curve's mean squared gap: 227.9 (sigma^2 = 225)
Even the true function has test error from the noise. A model with zero training error may have fit day-to-day variation instead of the shared relationship. The best any predictor can do is the conditional mean \(\mathbb{E}[Y \mid X = x]\), and Problem 5 proves its error floor \(\mathbb{E}[\mathrm{Var}(Y \mid X)]\) exactly. Next lecture derives the sum of squared gaps from maximum likelihood.